R语言 如何在R中使用plotly创建饼图
饼图是数据的圆形图形表示,根据数据集中存在的比例分为一些片断。
在R编程中,可以使用Plot_ly()函数绘制饼图,该函数存在于Plotly包中。在这篇文章中,我们将为CRAN资源库中的默认数据集iris绘制饼图。在Plotly中,饼图可以用不同的方式绘制,包括简单图、风格图和甜甜圈图。
加载库
由于我们需要Plotly库,我们可以用给定的命令安装和加载它。
# Install required package(plotly)
install.packages("plotly")

# Load the installed package into current working environment
library(plotly)
加载数据集
在这里,我们正在使用Iris数据集,所以我们需要加载它。为此,运行下面的代码。
# Load the dataset
data(iris)

# Convert the dataset into a data frame
df<-data.frame(iris)
一旦我们有了数据集,我们现在就可以绘制饼图了。让我们从简单饼图开始。
简单 饼状图
**语法: plot_ly(df,type,marker,labels,values) % >% layout() **
其中。
- df – 数据框架
- type – 用来指定我们要可视化的图的类型
- marker() – 用来设置标记基因型对象的函数
- labels – 数据集中分类变量的名称
- values – 在这里指定我们想要绘制的数据集中的列的值(可选)
- layout() – 这个函数用于根据需要改变布局(比如给绘图指定一个标题……)
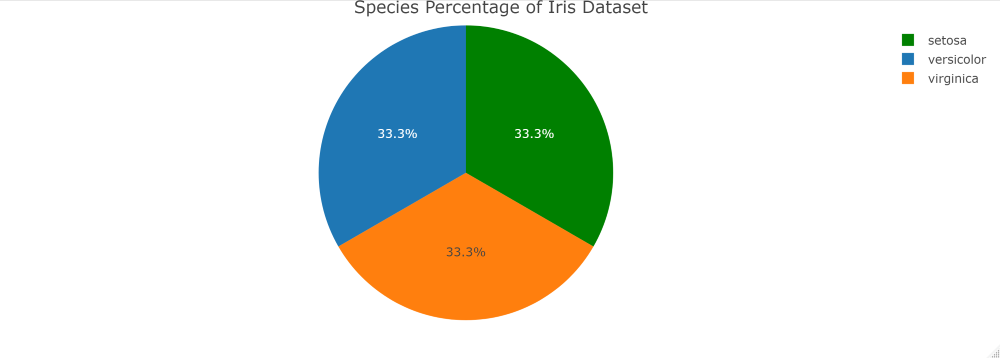
Pie_Data<-count(iris,Species)

# Plotting the piechart using plot_ly() function
plotly::plot_ly(data=Pie_Data,values=~n,labels=~factor(Species),
                marker=list(colors=c("green","orange","blue")),
                type="pie") %>% layout(title="Species Percentage of Iris Dataset")
输出 。

饼状图的样式
这里我们将为饼状图添加颜色、文本信息、文本位置等。
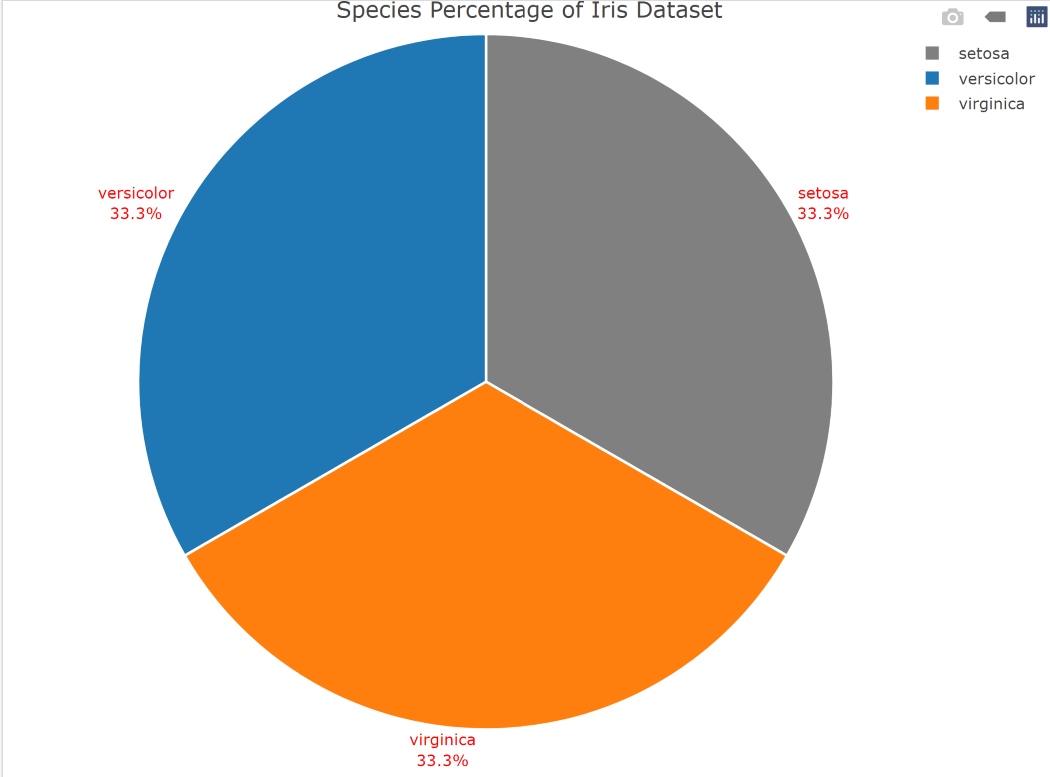
# Plotting the styled pie chart using plot_ly() function
plotly::plot_ly(data=Pie_Data,values=~n,labels=~factor(Species),
                textposition="outside",textinfo = 'label+percent',
                hoverinfo='label',outsidetextfont = list(color = 'red'),
                marker=list(colors=c("grey", 'blue', 'yellow'),
                line=list(color="white",width=2)),type="pie") %>%
                layout(title="Species Percentage of Iris Dataset")
输出 。

甜甜圈图
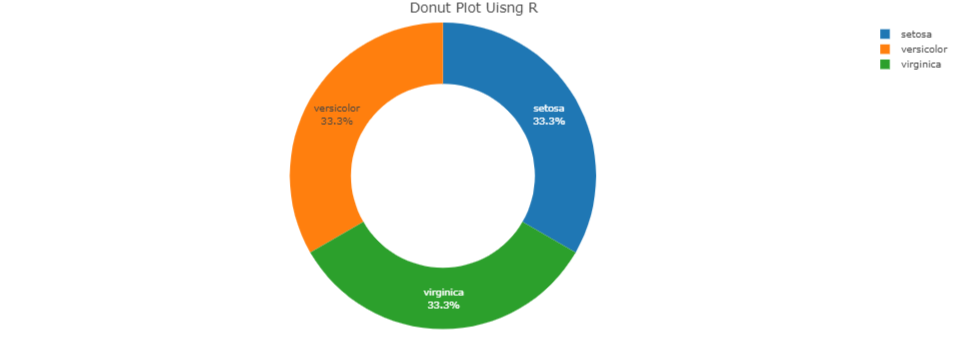
在多纳特饼图中,我们需要提到孔的价值。
plotly::plot_ly(Pie_Data)%>%
  add_pie(Pie_Data,labels=~factor(Species),values=~n,
          textinfo="label+percent",type='pie',hole=0.6)%>%
  layout(title="Donut Plot Using R")
输出 。
 极客教程
极客教程