R语言 如何创建一个森林图
在这篇文章中,我们将讨论如何在R编程语言中创建一个森林图。
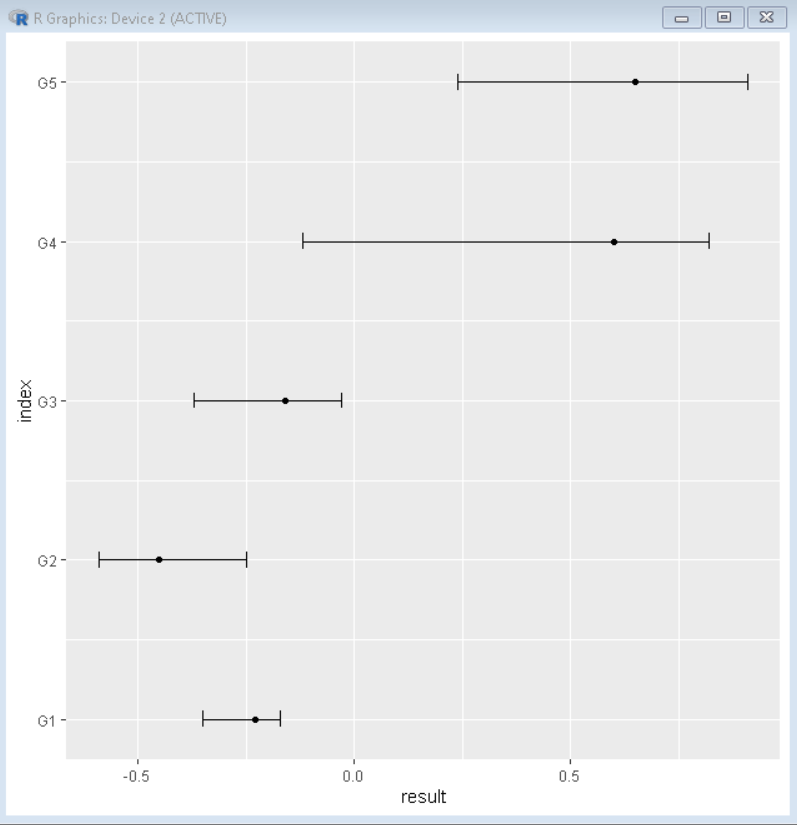
森林图也被称为blobbogram。它可以帮助我们将一定数量的研究的估计结果与总体结果一起在一个图中可视化。它被广泛用于医学研究中,用于可视化随机对照试验结果的元分析。该图的X轴包含研究中的兴趣值,Y轴显示不同试验的结果。
为了在R语言中创建一个森林图,我们使用散点图与误差条的组合。ggplot软件包的geom_point()函数帮助我们创建散点图。为了在散点图的基础上创建一个误差条图,我们使用geom_errorbarh()函数。geom_errorbarh()函数用于绘制一个水平误差条图。
语法 。
ggplot(data, aes( y, x, xmin, xmax ))+ geom_point() + geom_errorbarh( height )
参数 。
- data: 决定用于绘图的数据框架。
- x和y: 确定坐标轴的变量
- xmin和xmax: 确定x轴的极限值
- height: 决定误差条的宽度。
例子: 基本森林图。
# create sample data
sample_data <- data.frame(study=c('G1', 'G2', 'G3', 'G4', 'G5'),
                 index=1:5,
                 result=c(-.23, -.45, -.16, .6, .65),
                 error_lower=c(-.35, -.59, -.37, -.12, .24),
                 error_upper=c(-.17, -.25, -.03, .82, .91))

#load library ggplot2
library(ggplot2)

#create forest plot
ggplot(data=sample_data, aes(y=index, x=result,
                             xmin=error_lower,
                             xmax=error_upper)) +
  geom_point() +
  geom_errorbarh(height=.1) +
  scale_y_continuous(labels=sample_data$study)
输出 。

添加标题和改变图的轴标签
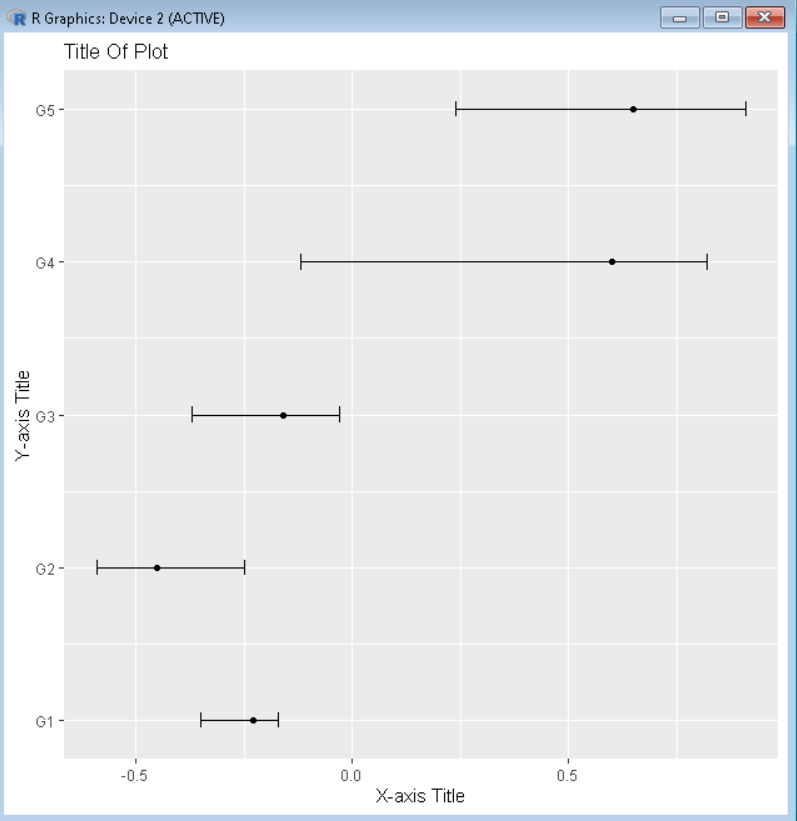
为了给图表添加标题,我们使用R语言中labs()函数的标题参数。我们还可以分别使用labs()函数的x和y参数来改变x轴和y轴的轴标签。
语法。
plot() + labs( title, x, y )
参数。
title: 决定了绘图的标题。
x和y: 分别决定x轴和y轴的轴的标题。
例子: 森林图,图和两个轴都有一个自定义的标题。
# create sample data
sample_data <- data.frame(study=c('G1', 'G2', 'G3', 'G4', 'G5'),
                 index=1:5,
                 result=c(-.23, -.45, -.16, .6, .65),
                 error_lower=c(-.35, -.59, -.37, -.12, .24),
                 error_upper=c(-.17, -.25, -.03, .82, .91))

#load library ggplot2
library(ggplot2)

#create forest plot
ggplot(data=sample_data, aes(y=index, x=result,
                             xmin=error_lower,
                             xmax=error_upper)) +
  geom_point() +
  geom_errorbarh(height=.1) +
  scale_y_continuous(labels=sample_data$study)+
  labs(title='Title Of Plot', x='X-axis Title', y = 'Y-axis Title')
输出 。

在绘图中添加一条垂直线
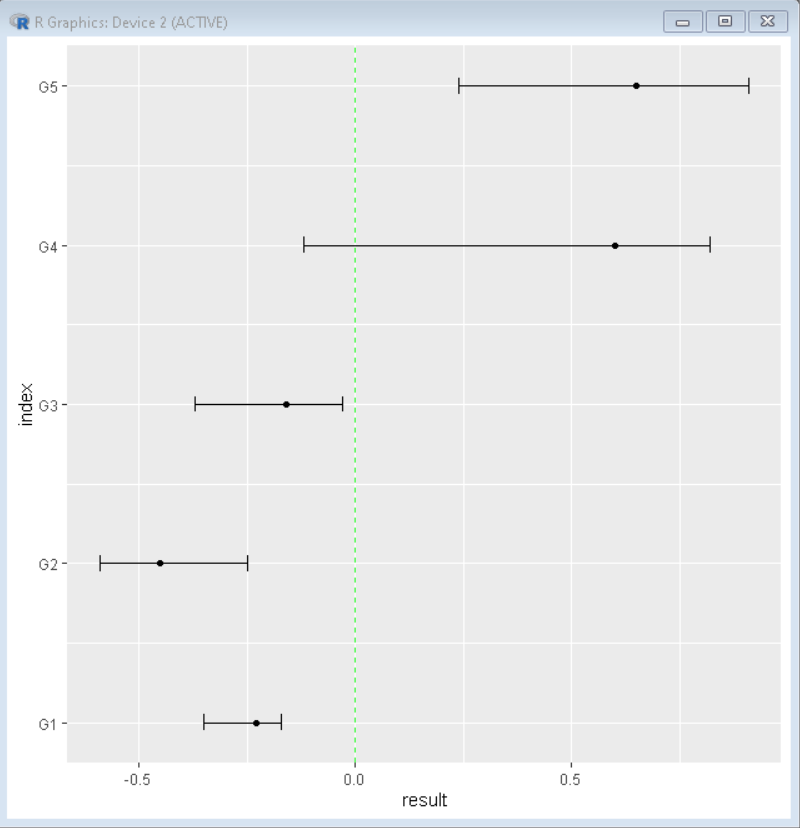
通过使用geom_vline()函数,在R语言中为绘图添加一条垂直线作为叠加。我们可以在图中添加一条垂直线,以显示零点的位置,从而更好地实现数据的可视化。我们可以使用geom_vline()函数的xintercept、linetype、color和alpha参数来分别定制垂直线的位置、线的形状、颜色和透明度。
语法。
plot + geom_vline( xintercept, linetype, color, alpha )
参数。
- xintercept: 决定线条在X轴上的位置。
- linetype: 决定线的形状。
- color: 决定线条的颜色。
- alpha: 决定线条的透明度。
例子: 在x=0处有一条垂直线的森林图。
# create sample data
sample_data <- data.frame(study=c('G1', 'G2', 'G3', 'G4', 'G5'),
                 index=1:5,
                 result=c(-.23, -.45, -.16, .6, .65),
                 error_lower=c(-.35, -.59, -.37, -.12, .24),
                 error_upper=c(-.17, -.25, -.03, .82, .91))

#load library ggplot2
library(ggplot2)

#create forest plot
ggplot(data=sample_data, aes(y=index, x=result,
                             xmin=error_lower,
                             xmax=error_upper)) +
  geom_point() +
  geom_errorbarh(height=.1) +
  scale_y_continuous(labels=sample_data$study)+
  geom_vline(xintercept=0, color='green', linetype='dashed', alpha=.8)
输出 。

森林图的定制
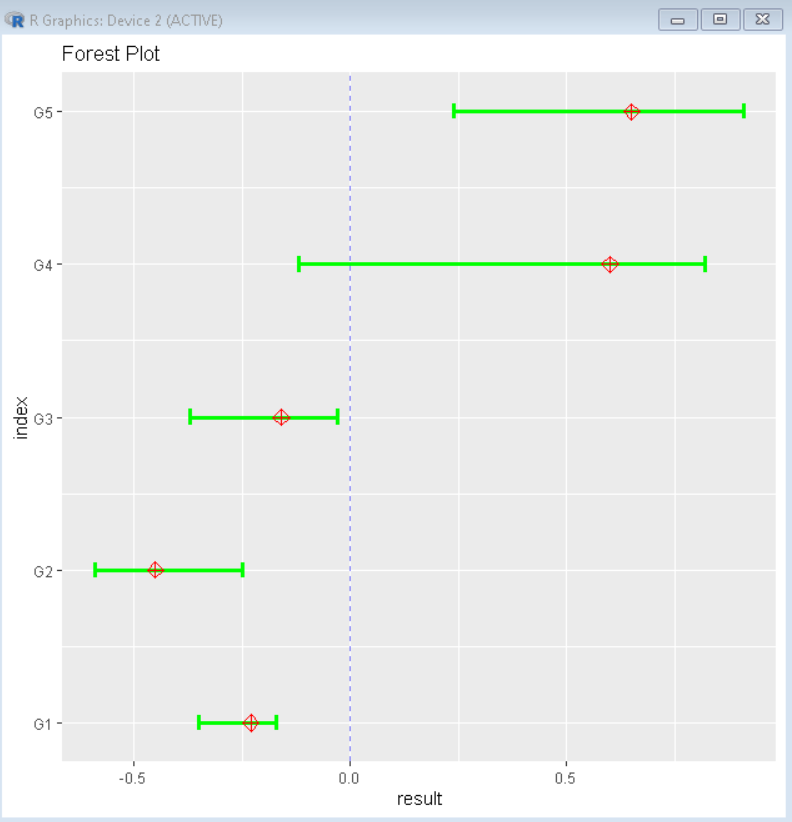
为了定制森林图,我们可以改变条形图和点的颜色和形状,使其更有信息量,也更有美感。为了改变颜色和大小,我们可以使用基本的美学参数,如color、lwd、pch等。
语法。
ggplot(data, aes(y, x, xmin, xmax))+ geom_errorbarh(height, color, lwd) + geom_point( color, pch, size)
参数。
- color: 决定点或误差条的颜色
- lwd: 决定误差条的线宽
- pch :决定点的形状。
例子 。
这里,是一个完全自定义的森林图。
# create sample data
sample_data <- data.frame(study=c('G1', 'G2', 'G3', 'G4', 'G5'),
                 index=1:5,
                 result=c(-.23, -.45, -.16, .6, .65),
                 error_lower=c(-.35, -.59, -.37, -.12, .24),
                 error_upper=c(-.17, -.25, -.03, .82, .91))

#load library ggplot2
library(ggplot2)

#create forest plot
ggplot(data=sample_data, aes(y=index, x=result,
                             xmin=error_lower,
                             xmax=error_upper)) +
  geom_errorbarh(height=.1, color= "green", lwd=1.2) +
  geom_point( color= "red", pch= 9, size=3) +
  scale_y_continuous(labels=sample_data$study)+
  labs(title="Forest Plot")+
  geom_vline(xintercept=0, color='blue', linetype='dashed', alpha=.5)
输出 。

 极客教程
极客教程