R语言 如何改变轴的域范围
在这篇文章中,我们将看到如何在R编程语言中改变一个轴的域范围。
layer_points() 方法可以使用数据框架中指定的点来绘制坐标。该方法的语法如下。
语法: layer_points(vis)
参数 :
- vis – ggvis对象
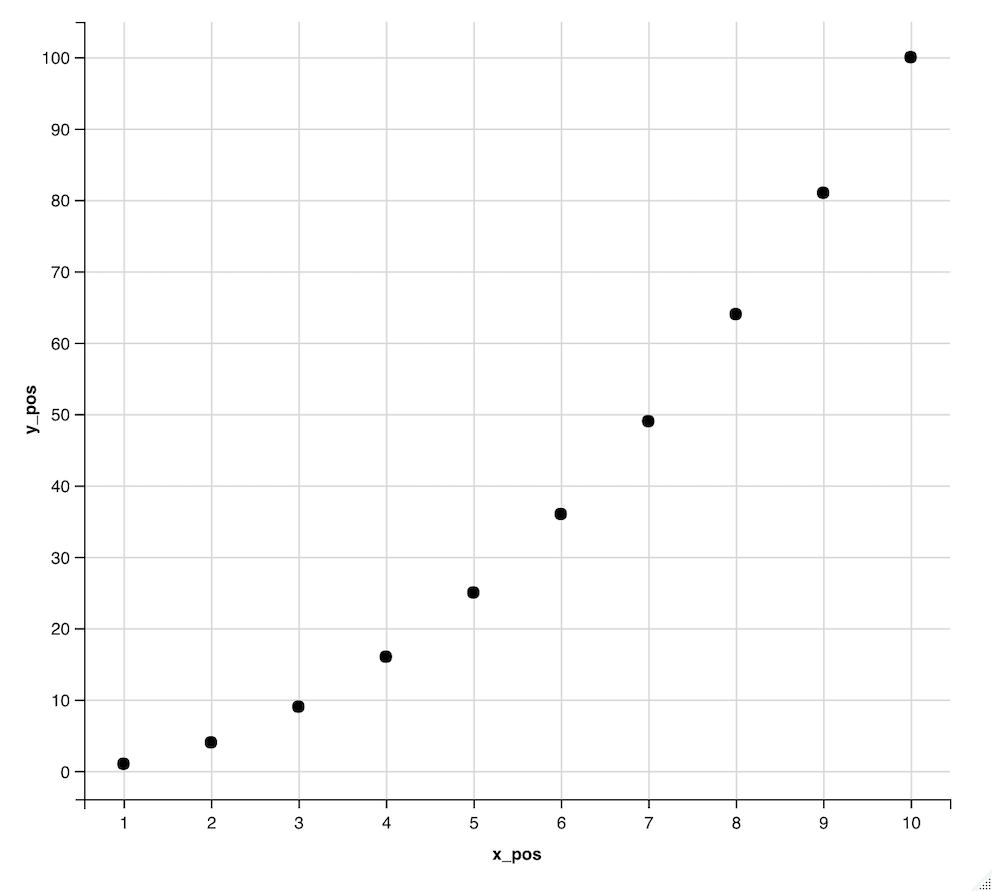
下面的代码片段表明,为一对指定范围的数值(x , x^2)创建了一个数据框架。然后这些坐标被绘制在ggvis图上。
# installing the required libraries
library(ggplot2)
library(ggvis)

# creating the data frame by
# defining the x and y coordinates
# respectively
data_frame <- data.frame(
  x_pos = 1:10,
  y_pos <- x_pos^2
)
print("Data Frame")
print(data_frame)

# plotting the points
data_frame %>% ggvis(~x_pos, ~y_pos)
%>% layer_points()
输出
[1] "Data Frame"
> print(data_frame)
  x_pos y_pos....x_pos.2
1      1                1
2      2                4
3      3                9
4      4               16
5      5               25
6      6               36
7      7               49
8      8               64
9      9               81
10    10              100

轴的比例可以通过指定域作为ggvis包中scale_numeric方法的参数来改变。上限和下限是在域参数中指定的。该方法的语法如下。
scale_numeric (vis, axis, domain)
参数 :
- vis – ggvis对象
- axis – 缩放范围的轴
- domain – 要绘制的新区间
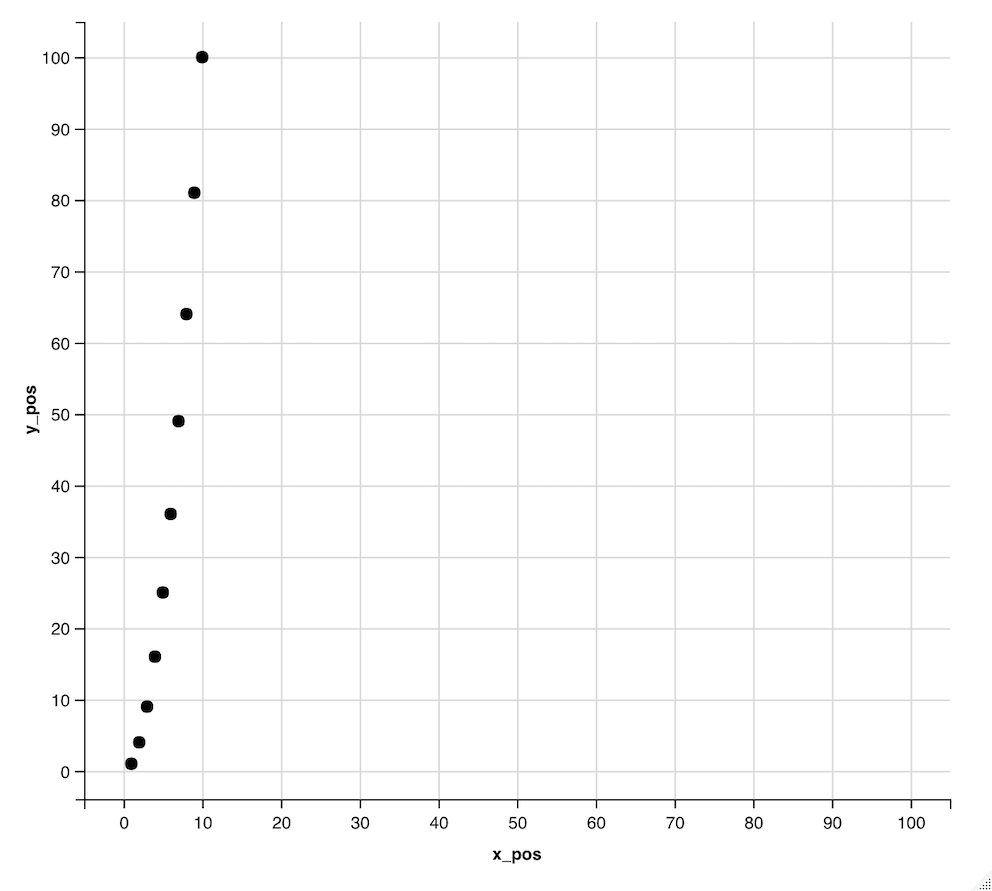
下面的代码表明X轴的范围要从0到100的区间中修改。
# installing the required libraries
library(ggplot2)
library(ggvis)

# creating the data frame by defining
# the x and y coordinates respectively
data_frame <- data.frame(
  x_pos = 1:10,
  y_pos <- x_pos^2
)
print("Data Frame")
print(data_frame)

# plotting the points
data_frame %>% ggvis(~x_pos, ~y_pos) %>% layer_points() %>%

# specifying the range of x axis
scale_numeric("x", domain = c(0, 100))
输出
[1] "Data Frame"
> print(data_frame)
 x_pos y_pos....x_pos.2
1      1                1
2      2                4
3      3                9
4      4               16
5      5               25
6      6               36
7      7               49
8      8               64
9      9               81
10    10              100

 极客教程
极客教程