R语言 如何的ggplot2中直接添加标签
标签是一种文本实体,它有关于它们所连接的数据点的信息,有助于确定这些数据点的背景。在这篇文章中,我们将讨论如何在R编程语言中直接向ggplot2添加标签。
为了在ggplot2绘图中直接添加标签,我们在数据框中添加与标签有关的数据。然后我们使用函数geom_text()或geom_label()在每个数据点旁边创建标签。这两个函数的工作原理是一样的,唯一的区别在于外观。geom_label()比geom_text()更容易定制。
方法1:使用geom_text()
这个方法是用来给ggplot2图中的数据点添加文本标签的。它的定位方式与geom_point()的定位方式相同。
语法: ggp + geom_text( label, nudge_x , nudge_y, check_overlap )
参数 。
- label: 我们想在数据点上显示的文本标签
- nudge_x: 将文本沿X轴移动。
- nudge_y: 沿着Y轴移动文字。
- check_overlap: 避免文字重叠。
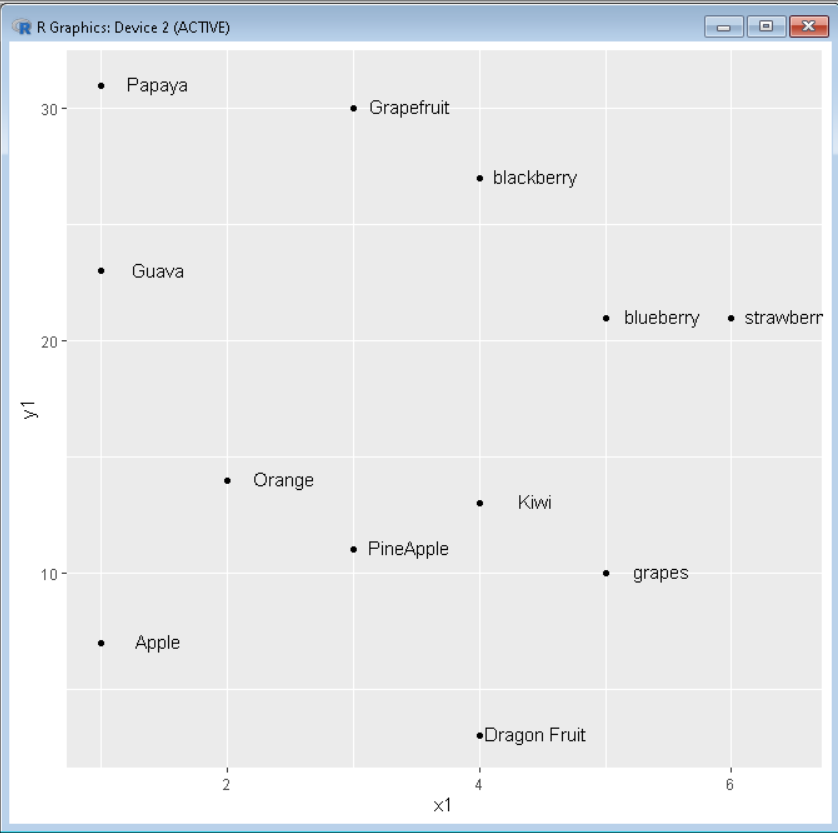
例子: 使用ggplot2和geom_text绘制带有标签的散点图。
# import library ggplot2
library(ggplot2)

# Create dataset
x1 < - c(1, 1, 1, 2, 3, 4, 4, 4, 5, 5, 6, 2, 3)
y1 < - c(7, 23, 31, 14, 11, 3, 13, 27, 21, 10, 21, 14, 30)
label1 < - c('Apple', 'Guava', 'Papaya', 'Orange', 'PineApple',
             'Dragon Fruit', 'Kiwi', 'blackberry', 'blueberry',
             'grapes', 'strawberry', 'raspberry', 'Grapefruit')

sample_data < - data.frame(x1, y1, label1)

# add text with geom_text
ggplot(sample_data, aes(x=x1, y=y1)) +
geom_point() +
geom_text(
    label=label1,
    nudge_x=0.45, nudge_y=0.1,
    check_overlap=T
)
输出 。
方法2: 使用 geom_label( )
这个方法是用来给ggplot2图中的数据点添加文本标签的。它与geom_text的工作原理基本相同,唯一的区别是它将标签包裹在一个矩形中。
语法: ggp + geom_label( label, nudge_x , nudge_y, check_overlap, label.padding, label.size, color, fill )
参数。
- label: 我们想在数据点上显示的文本标签
- nudge_x: 将文本沿X轴移动。
- nudge_y: 沿Y轴移动文本。
- check_overlap: 避免文字重叠。
- label.padding: 矩形重叠部分的padding。
- label.size: 矩形重叠部分的大小
- color: 标签中文字的颜色
- fill: 矩形重叠部分的背景颜色
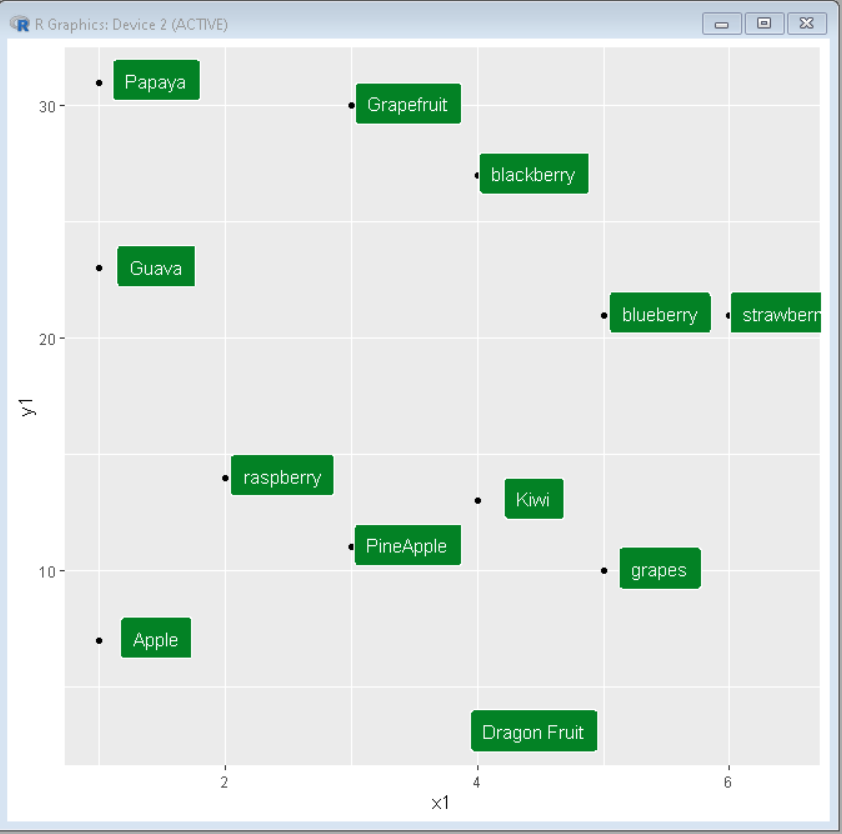
示例: 使用ggplot2和geom_label()绘制带有标签的散点图。
# import library ggplot2
library(ggplot2)

# Create dataset
x1 < - c(1, 1, 1, 2, 3, 4, 4, 4, 5, 5, 6, 2, 3)
y1 < - c(7, 23, 31, 14, 11, 3, 13, 27, 21, 10, 21, 14, 30)
label1 < - c('Apple', 'Guava', 'Papaya', 'Orange', 'PineApple',
             'Dragon Fruit', 'Kiwi', 'blackberry', 'blueberry',
             'grapes', 'strawberry', 'raspberry', 'Grapefruit')

sample_data < - data.frame(x1, y1, label1)

# add text with geom_text
ggplot(sample_data, aes(x=x1, y=y1)) +
geom_point() +
geom_label(
    label=label1,
    nudge_x=0.45, nudge_y=0.1,
    check_overlap=T,
    label.padding=unit(0.55, "lines"),
    label.size=0.4,
    color="white",
    fill="#038225"
)
输出 。
 极客教程
极客教程
