R语言 如何向ggplot2添加图像
在这篇文章中,我们将讨论如何使用R编程语言中的ggplot2在绘图中插入或添加图像。
该软件包的ggplot()方法用于初始化ggplot对象。它可以用来声明一个图形的输入数据框架,也可以用来指定一组图形的美学效果。ggplot()函数用于构造初始的绘图对象,并且几乎总是在其后面添加组件以添加到绘图中。
语法 。
ggplot(data, mapping = aes())
参数:
- data – 用于数据绘图的数据框架
- mapping – 用于绘图的美学映射的默认列表。
方法1:使用 patchwork包
jpeg “包用于提供一种简单的方法来执行对JPEG图像的操作,即读取、写入和显示以JPEG格式存储的位图图像。
语法 。
install.packages(“jpeg”)
这个包的readJPEG()方法是用来从JPEG文件/内容中访问图像到光栅阵列中的。它将一幅位图图像读成一个本地的光栅图像。
语法。
readJPEG(path, native = FALSE)
参数:
- path – 要进入工作空间的JPEG文件的名称。
- native – 图像表示法的指标。如果为 “true”,那么结果是一个本地光栅表示法。
另一个包 “patchwork “通过提供数学运算符来组合多个图,允许任意复杂的图的组合。它用于增强和描述性绘图的构建和分析。它主要是为ggplot2的用户准备的,并确保其正确对齐。
语法 。
install.packages(“patchwork”)
该包的inset_element()函数提供了一种创建额外的嵌入物的方法,并让你完全控制这些嵌入物的位置和相互之间的方向。该方法将指定的图形标记为要添加到前面的绘图中的一个插页。
语法。
inset_element( p, left, bottom, right, top)
参数。
- p – 一个grob、ggplot、patchwork、formula、raster或nativeRaster对象,将被添加到绘图中的一个插页。
- left, bottom, right, top – 添加p的坐标位置。
例子 。
# loading the required libraries
library("jpeg")
library("ggplot2")
library("patchwork")

# defining the x coordinates
xpos <- 1:5

# defining the y coordinates
ypos <- xpos**2

data_frame = data.frame(xpos = xpos,
                        ypos = ypos)

print ("Data points")
print (data_frame)

# plotting the data
graph <- ggplot(data_frame, aes(xpos, ypos)) +
  geom_point()

# specifying the image path
path <- "/Users/mallikagupta/Desktop/GFG/gfg.jpeg"

# read the jpef file from device
img <- readJPEG(path, native = TRUE)

# adding image to graph
img_graph <- graph +
  inset_element(p = img,
                left = 0.05,
                bottom = 0.65,
                right = 0.5,
                top = 0.95)

# printing graph with image
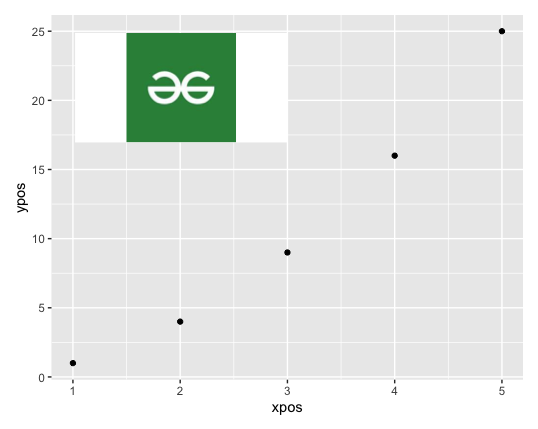
print (img_graph)
输出
[1] "Data points"
   xpos ypos
1    1    1
2    2    4
3    3    9
4    4   16
5    5   25

方法2:使用grid包
R中的grid包关注的是用于创建ggplot2绘图系统的图形函数。
语法 。
install.packages(“grid”)
R中的rasterGrob()方法用于在工作空间中创建一个光栅图像图形对象。它将图像路径(PNG或JPEG)作为第一个参数输入,并将其转换为光栅图形图像。
语法 。
rasterGrob (path, interpolate = TRUE)
R中的qplot()方法是用来创建快速绘图的,它可以作为创建绘图的其他各种方法的包装。它使创建复杂的图形变得更加容易。
语法。
qplot(x, y=NULL, data, geom=”auto”, xlim=c(NA, NA), ylim=c(NA, NA))
参数:
- x, y – x和y坐标
- data – 要使用的数据框架
- geom – 要使用的地理框架的指标
- xlim, ylim – X和Y轴的限制
annotation_custom()可以与qplot()方法结合使用,qplot()是一个特殊的geom,旨在作为静态注释使用。使用这个选项,绘图的实际比例仍未被修改。
语法。
annotation_custom(grob, xmin = -Inf, xmax = Inf, ymin = -Inf, ymax = Inf)
参数 :
- g – 要显示的格罗布
- xlim, ylim – X轴和Y轴的限制
例子 。
# loading the required libraries
library("jpeg")
library("ggplot2")
library("grid")

# defining the x coordinates
xpos <- 1:5

# defining the y coordinates
ypos <- xpos**2

data_frame = data.frame(xpos = xpos,
                        ypos = ypos)

print ("Data points")
print (data_frame)

# specifying the image path
path <- "/Users/mallikagupta/Desktop/GFG/gfg.jpeg"

# read the jpef file from device
img <- readJPEG(path, native = TRUE)

# converting to raster image
img <- rasterGrob(img, interpolate=TRUE)

# plotting the data
qplot(xpos, ypos, geom="blank") +
  annotation_custom(g, xmin=-Inf, xmax=Inf, ymin=-Inf, ymax=Inf) +
  geom_point()
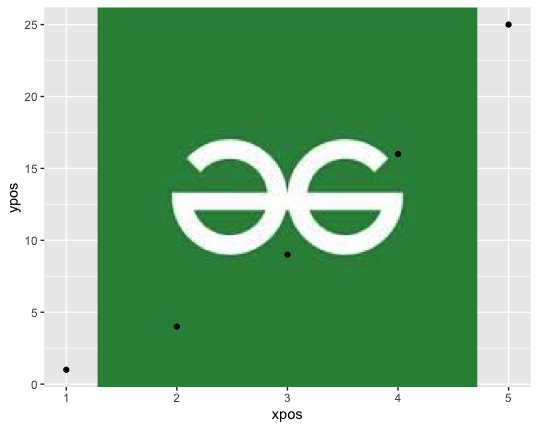
输出
[1] "Data points"
  xpos ypos
1    1    1
2    2    4
3    3    9
4    4   16
5    5   25

 极客教程
极客教程