Python中的Pandas分析
Python中的pandas_profiling库包括一个名为ProfileReport()的方法,它可以为输入的DataFrame生成一个基本报告。
该报告包括以下内容。
- DataFrame overview,
- 定义DataFrame的每个属性。
- 属性之间的相关关系(皮尔逊相关和斯皮尔曼相关),以及
- DataFrame的一个例子。
语法 :
pandas_profiling.ProfileReport(df, **kwargs)
| 参数 | 类型 | 描述 |
|---|---|---|
| df | DataFrame | 要分析的数据 |
| bins | int | 直方图中的bin数量。默认为10。 |
| check_correlation | boolean | 是否要检查相关性。默认为 “True”。 |
| correlation_threshold | float | 用于确定变量对是否相关的阈值。默认为0.9。 |
| correlation_overrides | list | 变量名称不会因为它们是相关的而被拒绝。列表中默认没有变量(None)。 |
| check_recoded | boolean | 是否检查重新编码的相关关系(内存大的特性)。因为这是一个昂贵的计算,对于小的数据集可以激活它。`check_correlation’必须为true才能禁用这个检查。默认情况下是 “假”。 |
| pool_size | int | 线程池中的工作者数量。默认情况下等于CPU的数量。 |
示例:
# importing packages
import pandas as pd
import pandas_profiling as pp


# dictionary of data
dct = {'ID': {0: 23, 1: 43, 2: 12, 3: 13,
              4: 67, 5: 89, 6: 90, 7: 56,
              8: 34},
       'Name': {0: 'Ram', 1: 'Deep', 2: 'Yash',
                3: 'Aman', 4: 'Arjun', 5: 'Aditya',
                6: 'Divya', 7: 'Chalsea',
                8: 'Akash' },
       'Marks': {0: 89, 1: 97, 2: 45, 3: 78,
                 4: 56, 5: 76, 6: 100, 7: 87,
                 8: 81},
       'Grade': {0: 'B', 1: 'A', 2: 'F', 3: 'C',
                 4: 'E', 5: 'C', 6: 'A', 7: 'B',
                 8: 'B'}
      }

# forming dataframe and printing
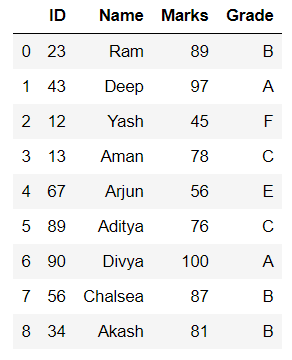
data = pd.DataFrame(dct)
print(data)

# forming ProfileReport and save
# as output.html file
profile = pp.ProfileReport(data)
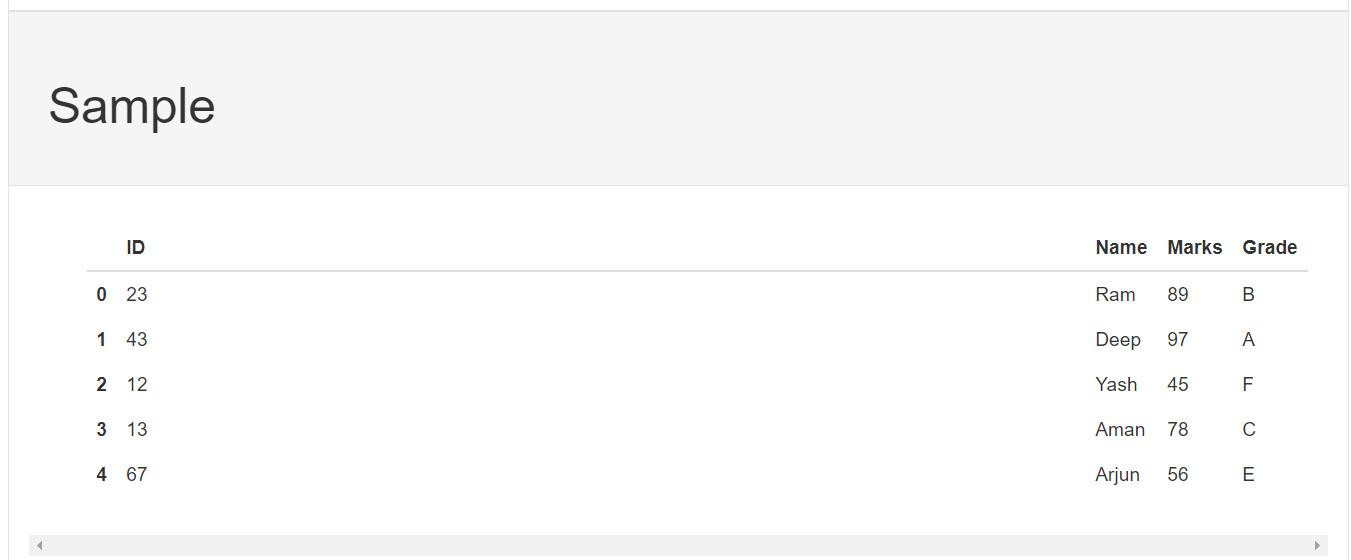
profile.to_file("output.html")
输出:

DataFrame
命名为output.html的html文件如下。

 极客教程
极客教程