用Pandas分析TRAI的移动数据速度
Python是一种进行数据分析的伟大语言,主要是因为以数据为中心的Python软件包的奇妙生态系统。Pandas就是这些包中的一个,它使导入和分析数据变得更加容易。
让我们使用来自TRAI的真实数据集来分析移动数据的速度,并尝试看看某个运营商或州在该月的平均速度。这也将表明Pandas可以很容易地用于任何真实世界的数据,得出有趣的结果。
关于数据集
印度电信管理局(TRAI)每月都会发布其通过MySpeed(TRAI)应用程序测量的网速数据集。这包括由用户自己发起的速度测试,或由应用程序定期进行的背景测试。我们将尝试分析这个数据集,看看某个运营商或州在该月的平均速度。
检查数据的原始结构。
- 进入TRAI MySpeed门户网站,在下载部分下载最新月份的csv文件。你也可以下载本文中使用的csv文件:sept18_publish.csv或sept18_publish_drive.csv。

- 打开这个电子表格文件。
注意 。由于数据集很大,软件可能会给你一个警告,说无法加载所有的行。这是好的。另外,如果你使用的是Microsoft Excel,可能会有一个关于打开SYLK文件的警告。这个错误可以忽略,因为它是Excel的一个常见错误。
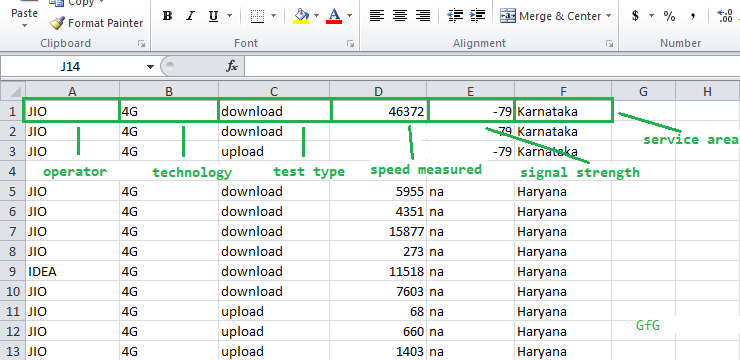
现在,让我们来看看数据的安排–

数据集中的列名
第一栏是网络运营商 – JIO、Airtel等。
第二栏是网络技术–3G或4G。
第三栏是启动的测试类型 – 上传或下载。
第四列是速度,以千字节/秒计算。
第5栏是测量时的信号强度。
第6栏是当地服务区(LSA),或做测试的圈子–德里、奥里萨等。我们将把它简单地称为 “州”。
注意:信号强度可能有na(不可用)值,因为有些设备无法捕获信号。在我们的计算中,我们将忽略使用这个参数,以使事情更简单。然而,它可以很容易地在过滤时作为一个条件加入。
需要的软件包:
Pandas – 一个流行的数据分析工具箱。在处理大型数据集方面非常强大。
Numpy – 对同质数据的数组提供快速有效的操作。我们将与pandas和matplotlib一起使用它。
Matplotlib – 是一个绘图库。我们将使用它的条形图绘制功能来制作条形图。
让我们开始分析数据。
第1步:导入软件包并定义一些常量。
“`python import pandas as pd
import numpy as np
import matplotlib.pyplot as plt
# we will define some constants
# name of the csv dataset
DATASET_FILENAME = 'sept18_publish.csv'
# define the operator to be filtered upon.
CONST_OPERATOR = 'JIO'
# define the state to be filtered upon.
CONST_STATE = 'Delhi'
# define the the technology to be filtered upon
CONST_TECHNOLOGY = '4G'
<pre><code class=""><br /><br />**第二步:**定义一些列表来存储最终的计算结果,这样就可以很容易地把它传递给条形图绘制函数。状态(或操作者)、下载速度和上传速度将被连续存储,因此对于一个索引,可以访问状态(或操作者)、它相应的下载和上传速度。
例如,final_states[2]、final_download_speeds[2]和final_upload_speeds[2]将给出第三个状态的相应值。
“`python # define lists
final_download_speeds = []
final_upload_speeds = []
final_states = []
final_operators = []
第三步:使用Pandas read_csv()函数导入文件,并将其存储在’df’中。这将创建一个csv内容的DataFrame,我们将在其中工作。
“`python df = pd.read_csv(DATASET_FILENAME)
# assign headers for each of the columns based on the data
# this allows us to access columns easily
df.columns = ['Service Provider', 'Technology', 'Test Type',
'Data Speed', 'Signal Strength', 'State']
<pre><code class=""><br />**第四步:**首先让我们在这个数据集中找到所有独特的状态和运算符,并将它们存储到相应的状态和运算符列表中。
我们将使用Pandas数据框架的unique()方法。
“`python # find and display the unique states
states = df[‘State’].unique()
print(‘STATES Found: ‘, states)
# find and display the unique operators
operators = df[‘Service Provider’].unique()
print(‘OPERATORS Found: ‘, operators)
输出:
“`python STATES Found: [‘Kerala’ ‘Rajasthan’ ‘Maharashtra’ ‘UP East’ ‘Karnataka’ nan
'Madhya Pradesh' 'Kolkata' 'Bihar' 'Gujarat' 'UP West' 'Orissa'
'Tamil Nadu' 'Delhi' 'Assam' 'Andhra Pradesh' 'Haryana' 'Punjab'
'North East' 'Mumbai' 'Chennai' 'Himachal Pradesh' 'Jammu & Kashmir'
'West Bengal']
OPERATORS Found: ['IDEA' 'JIO' 'AIRTEL' 'VODAFONE' 'CELLONE']
<pre><code class=""><br />**第5步:**定义函数fixed_operator ,它将保持运算符不变,并迭代该运算符的所有可用状态。我们可以为固定状态构造一个类似的函数。
“`python # filter out the operator and technology
# first as this will be common for all
filtered = df[(df[‘Service Provider’] == CONST_OPERATOR)
& (df[‘Technology’] == CONST_TECHNOLOGY)]
# iterate through each of the states
for state in states:
# create new dataframe which contains
# only the data of the current state
base = filtered[filtered[‘State’] == state]
# filter only download speeds based on test type
down = base[base[‘Test Type’] == ‘download’]
# filter only upload speeds based on test type
up = base[base[‘Test Type’] == ‘upload’]
# calculate mean of speeds in Data Speed
# column using the Pandas.mean() method
avg_down = down[‘Data Speed’].mean()
# calculate mean of speeds
# in Data Speed column
avg_up = up[‘Data Speed’].mean()
# discard values if mean is not a number(nan)
# and append only the valid ones
if (pd.isnull(avg_down) or pd.isnull(avg_up)):
down, up = 0, 0
else:
final_states.append(state)
final_download_speeds.append(avg_down)
final_upload_speeds.append(avg_up)
# print output upto 2 decimal places
print(str(state) + ‘ — Avg. Download: ‘ +
str(‘%.2f’ % avg_down) +
‘ Avg. Upload: ‘ + str(‘%.2f’ % avg_up))
输出:
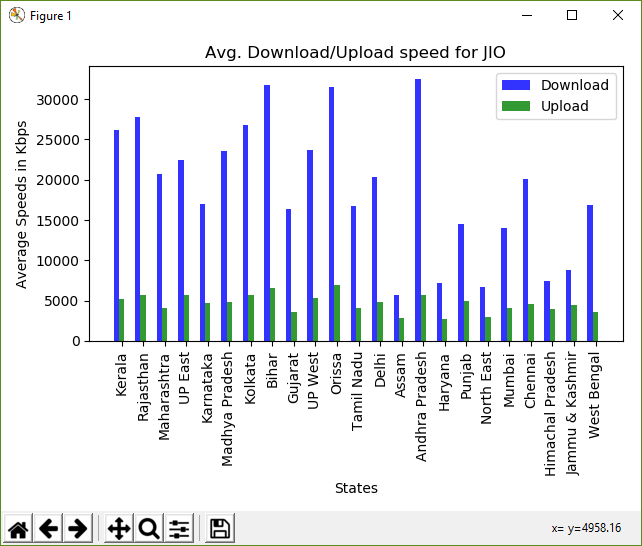
“`python Kerala — Avg. Download: 26129.27 Avg. Upload: 5193.46
Rajasthan — Avg. Download: 27784.86 Avg. Upload: 5736.18
Maharashtra — Avg. Download: 20707.88 Avg. Upload: 4130.46
UP East — Avg. Download: 22451.35 Avg. Upload: 5727.95
Karnataka — Avg. Download: 16950.36 Avg. Upload: 4720.68
Madhya Pradesh — Avg. Download: 23594.85 Avg. Upload: 4802.89
Kolkata — Avg. Download: 26747.80 Avg. Upload: 5655.55
Bihar — Avg. Download: 31730.54 Avg. Upload: 6599.45
Gujarat — Avg. Download: 16377.43 Avg. Upload: 3642.89
UP West — Avg. Download: 23720.82 Avg. Upload: 5280.46
Orissa — Avg. Download: 31502.05 Avg. Upload: 6895.46
Tamil Nadu — Avg. Download: 16689.28 Avg. Upload: 4107.44
Delhi — Avg. Download: 20308.30 Avg. Upload: 4877.40
Assam — Avg. Download: 5653.49 Avg. Upload: 2864.47
Andhra Pradesh — Avg. Download: 32444.07 Avg. Upload: 5755.95
Haryana — Avg. Download: 7170.63 Avg. Upload: 2680.02
Punjab — Avg. Download: 14454.45 Avg. Upload: 4981.15
North East — Avg. Download: 6702.29 Avg. Upload: 2966.84
Mumbai — Avg. Download: 14070.97 Avg. Upload: 4118.21
Chennai — Avg. Download: 20054.47 Avg. Upload: 4602.35
Himachal Pradesh — Avg. Download: 7436.99 Avg. Upload: 4020.09
Jammu & Kashmir — Avg. Download: 8759.20 Avg. Upload: 4418.21
West Bengal — Avg. Download: 16821.17 Avg. Upload: 3628.78
<pre><code class=""><br />### 绘制数据
使用Numpy的range()方法,它可以在一个给定的区间内返回均匀的数值。在这里,传递final_states列表的长度,因此我们得到从0到列表中的状态数的值,如[0, 1, 2, 3 …] 。
然后我们可以使用这些指数在该位置绘制一个条形图。第二个条形图是通过将第一个条形图的位置偏移条形图的宽度来绘制的。
“`python fig, ax = plt.subplots()
# the width of each bar
bar_width = 0.25
# opacity of each bar
opacity = 0.8
# store the positions
index = np.arange(len(final_states))
# the plt.bar() takes in the position
# of the bars, data to be plotted,
# width of each bar and some other
# optional parameters, like the opacity and colour
# plot the download bars
bar_download = plt.bar(index, final_download_speeds,
bar_width, alpha=opacity,
color=’b’, label=’Download’)
# plot the upload bars
bar_upload = plt.bar(index + bar_width, final_upload_speeds,
bar_width, alpha=opacity, color=’g’,
label=’Upload’)
# title of the graph
plt.title(‘Avg. Download/Upload speed for ‘
+ str(CONST_OPERATOR))
# the x-axis label
plt.xlabel(‘States’)
# the y-axis label
plt.ylabel(‘Average Speeds in Kbps’)
# the label below each of the bars,
# corresponding to the states
plt.xticks(index + bar_width, final_states, rotation=90)
# draw the legend
plt.legend()
# make the graph layout tight
plt.tight_layout()
# show the graph
plt.show()

计算速度的柱状图
比较两个月的数据
让我们也拿一些另一个月的数据,把它们画在一起,观察数据速度的差异。
对于这个例子,上个月的数据集将是相同的sept18_publish.csv,下个月的数据集是oct18_publish.csv。
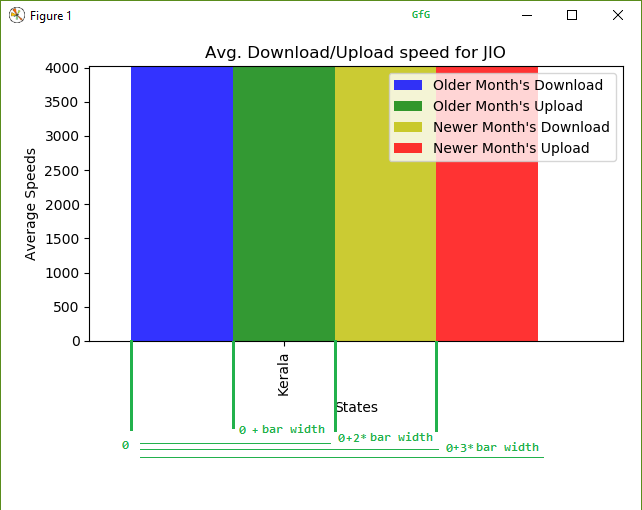
我们只需要再次执行同样的步骤。读取另一个月的数据。将其过滤到随后的数据框中,然后用稍微不同的方法绘制。在绘制条形图的过程中,我们将把第3条和第4条(对应于第二个文件的上传和下载)分别增加2倍和3倍的条形宽度,这样它们就处于正确的位置。

绘制4根柱子时的偏移逻辑
下面是比较2个月的数据的实施情况。
“`python import pandas as pd
import numpy as np
import matplotlib.pyplot as plt
import time
# older month
DATASET_FILENAME = 'https://myspeed.trai.gov.in/download/sept18_publish.csv'
# newer month
DATASET_FILENAME2 = 'https://myspeed.trai.gov.in/download/oct18_publish.csv'
CONST_OPERATOR = 'JIO'
CONST_STATE = 'Delhi'
CONST_TECHNOLOGY = '4G'
# read file with Pandas and store as Dataframe
df = pd.read_csv(DATASET_FILENAME)
df2 = pd.read_csv(DATASET_FILENAME2)
# assign column names
df.columns = ['Service Provider', 'Technology', 'Test Type',
'Data Speed', 'Signal Strength', 'State']
df2.columns = ['Service Provider', 'Technology', 'Test Type',
'Data Speed', 'Signal Strength', 'State']
# find and display the unique states
states = df['State'].unique()
print('STATES Found: ', states)
# find and display the unique operators
operators = df['Service Provider'].unique()
print('OPERATORS Found: ', operators)
# define lists
final_download_speeds = []
final_upload_speeds = []
final_download_speeds_second =[]
final_upload_speeds_second = []
final_states = []
final_operators = []
# assign column names to the data
df.columns = ['Service Provider', 'Technology', 'Test Type',
'Data Speed', 'Signal Strength', 'State']
df2.columns = ['Service Provider', 'Technology', 'Test Type',
'Data Speed', 'Signal Strength', 'State']
print('\n\nComparing data for' + str(CONST_OPERATOR))
filtered = df[(df['Service Provider'] == CONST_OPERATOR)
& (df['Technology'] == CONST_TECHNOLOGY)]
filtered2 = df2[(df2['Service Provider'] == CONST_OPERATOR)
& (df2['Technology'] == CONST_TECHNOLOGY)]
for state in states:
base = filtered[filtered['State'] == state]
# calculate mean of download speeds
avg_down = base[base['Test Type'] ==
'download']['Data Speed'].mean()
# calculate mean of upload speeds
avg_up = base[base['Test Type'] ==
'upload']['Data Speed'].mean()
base2 = filtered2[filtered2['State'] == state]
# calculate mean of download speeds
avg_down2 = base2[base2['Test Type'] ==
'download']['Data Speed'].mean()
# calculate mean of upload speeds
avg_up2 = base2[base2['Test Type'] ==
'upload']['Data Speed'].mean()
# discard values if mean is not a number(nan)
# and append only the needed speeds
if (pd.isnull(avg_down) or pd.isnull(avg_up) or
pd.isnull(avg_down2) or pd.isnull(avg_up2)):
avg_down = 0
avg_up = 0
avg_down2 = 0
avg_up2 = 0
else:
final_states.append(state)
final_download_speeds.append(avg_down)
final_upload_speeds.append(avg_up)
final_download_speeds_second.append(avg_down2)
final_upload_speeds_second.append(avg_up2)
print('Older: ' + str(state) + ' — Download: ' +
str('%.2f' % avg_down) + ' Upload: ' +
str('%.2f' % avg_up))
print('Newer: ' + str(state) + ' — Download: ' +
str('%.2f' % avg_down2) + ' Upload: ' +
str('%.2f' % avg_up2))
# plot bargraph
fig, ax = plt.subplots()
index = np.arange(len(final_states))
bar_width = 0.2
opacity = 0.8
rects1 = plt.bar(index, final_download_speeds,
bar_width, alpha=opacity, color='b',
label='Older Month\'s Download')
rects2 = plt.bar(index + bar_width, final_upload_speeds,
bar_width, alpha=opacity, color='g',
label='Older Month\'s Upload')
rects3 = plt.bar(index + 2 * bar_width, final_download_speeds_second,
bar_width, alpha=opacity, color='y',
label='Newer Month\'s Download')
rects4 = plt.bar(index + 3 * bar_width, final_upload_speeds_second,
bar_width, alpha=opacity, color='r',
label='Newer Month\'s Upload')
plt.xlabel('States')
plt.ylabel('Average Speeds')
plt.title('Avg. Download/Upload speed for '
+ str(CONST_OPERATOR))
plt.xticks(index + bar_width, final_states, rotation=90)
plt.legend()
plt.tight_layout()
plt.show()
<pre><code class=""><br />**输出:**
“`python STATES Found: [‘Kerala’ ‘Rajasthan’ ‘Maharashtra’ ‘UP East’ ‘Karnataka’ nan
‘Madhya Pradesh’ ‘Kolkata’ ‘Bihar’ ‘Gujarat’ ‘UP West’ ‘Orissa’
‘Tamil Nadu’ ‘Delhi’ ‘Assam’ ‘Andhra Pradesh’ ‘Haryana’ ‘Punjab’
‘North East’ ‘Mumbai’ ‘Chennai’ ‘Himachal Pradesh’ ‘Jammu & Kashmir’
‘West Bengal’]
OPERATORS Found: [‘IDEA’ ‘JIO’ ‘AIRTEL’ ‘VODAFONE’ ‘CELLONE’]
python     Comparing data forJIO

    Older: Kerala -- Download: 26129.27  Upload: 5193.46

    Newer: Kerala -- Download: 18917.46  Upload: 4290.13

    Older: Rajasthan -- Download: 27784.86  Upload: 5736.18

    Newer: Rajasthan -- Download: 13973.66  Upload: 4721.17

    Older: Maharashtra -- Download: 20707.88  Upload: 4130.46

    Newer: Maharashtra -- Download: 26285.47  Upload: 5848.77

    Older: UP East -- Download: 22451.35  Upload: 5727.95

    Newer: UP East -- Download: 24368.81  Upload: 6101.20

    Older: Karnataka -- Download: 16950.36  Upload: 4720.68

    Newer: Karnataka -- Download: 33521.31  Upload: 5871.38

    Older: Madhya Pradesh -- Download: 23594.85  Upload: 4802.89

    Newer: Madhya Pradesh -- Download: 16614.49  Upload: 4135.70

    Older: Kolkata -- Download: 26747.80  Upload: 5655.55

    Newer: Kolkata -- Download: 23761.85  Upload: 5153.29

    Older: Bihar -- Download: 31730.54  Upload: 6599.45

    Newer: Bihar -- Download: 34196.09  Upload: 5215.58

    Older: Gujarat -- Download: 16377.43  Upload: 3642.89

    Newer: Gujarat -- Download: 9557.90  Upload: 2684.55

    Older: UP West -- Download: 23720.82  Upload: 5280.46

    Newer: UP West -- Download: 35035.84  Upload: 5797.93

    Older: Orissa -- Download: 31502.05  Upload: 6895.46

    Newer: Orissa -- Download: 31826.96  Upload: 6968.59

    Older: Tamil Nadu -- Download: 16689.28  Upload: 4107.44

    Newer: Tamil Nadu -- Download: 27306.54  Upload: 5537.58

    Older: Delhi -- Download: 20308.30  Upload: 4877.40

    Newer: Delhi -- Download: 25198.16  Upload: 6228.81

    Older: Assam -- Download: 5653.49  Upload: 2864.47

    Newer: Assam -- Download: 5243.34  Upload: 2676.69

    Older: Andhra Pradesh -- Download: 32444.07  Upload: 5755.95

    Newer: Andhra Pradesh -- Download: 19898.16  Upload: 4002.25

    Older: Haryana -- Download: 7170.63  Upload: 2680.02

    Newer: Haryana -- Download: 8496.27  Upload: 2862.61

    Older: Punjab -- Download: 14454.45  Upload: 4981.15

    Newer: Punjab -- Download: 17960.28  Upload: 4885.83

    Older: North East -- Download: 6702.29  Upload: 2966.84

    Newer: North East -- Download: 6008.06  Upload: 3052.87

    Older: Mumbai -- Download: 14070.97  Upload: 4118.21

    Newer: Mumbai -- Download: 26898.04  Upload: 5539.71

    Older: Chennai -- Download: 20054.47  Upload: 4602.35

    Newer: Chennai -- Download: 36086.70  Upload: 6675.70

    Older: Himachal Pradesh -- Download: 7436.99  Upload: 4020.09

    Newer: Himachal Pradesh -- Download: 9277.45  Upload: 4622.25

    Older: Jammu & Kashmir -- Download: 8759.20  Upload: 4418.21

    Newer: Jammu & Kashmir -- Download: 9290.38  Upload: 4533.08

    Older: West Bengal -- Download: 16821.17  Upload: 3628.78

    Newer: West Bengal -- Download: 9763.05  Upload: 2627.28

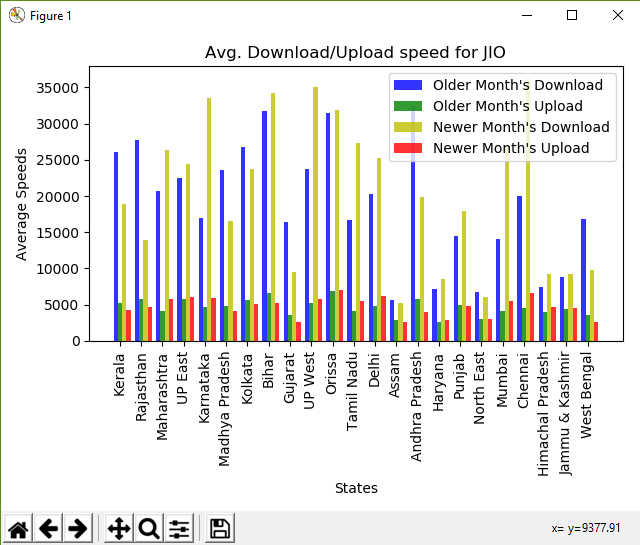
输出的柱状图
我们刚刚学会了如何分析一些真实世界的数据,并从中得出一些有趣的观察。但要注意的是,并不是所有的数据都会有那么好的格式和简单的处理方式,Pandas让处理这样的数据集变得无比简单。
 极客教程
极客教程