在Pandas Dataframe中突出显示nan值
在这篇文章中,我们将讨论如何在Pandas Dataframe中突出NaN(非数字)值。NaN值用来代表NULL值,有时它是数学溢出的结果。
让我们首先制作一个数据框架。
# Import Required Libraries
import pandas as pd
import numpy as np

# Create a dictionary for the dataframe
dict = {'Name': ['Sumit Tyagi', 'Sukritin', 'Akriti Goel',
                 'Sanskriti', 'Abhishek Jain'],
        'Age': [22, 20, np.nan, np.nan, 22],
        'Marks': [90, 84, 33, 87, 82]}

# Converting Dictionary to Pandas Dataframe
df = pd.DataFrame(dict)

# Print Dataframe
df
输出:
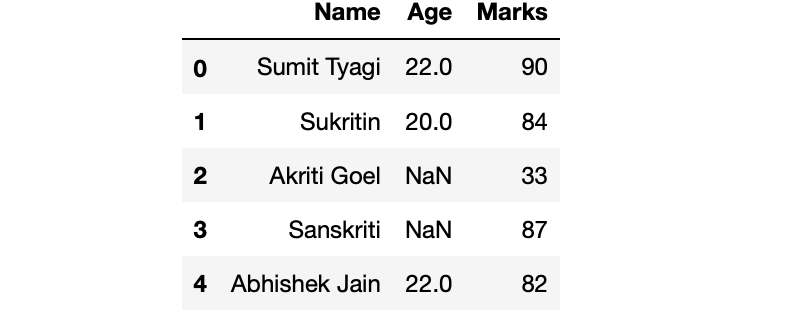
现在,来看看突出显示的部分。我们的目标是突出显示那些有Nan值的单元格。
方法1:突出显示有纳数值的单元格
我们可以通过使用DataFrame.style属性的highlight_null()方法来做到这一点。这是一个返回Styler对象的属性,它具有格式化和显示DataFrame的有用方法。 highlight_null()方法需要一个字符串参数(你想突出显示单元格的颜色名称)。
示例:
# Highlighting cell with nan values
df.style.highlight_null('red')
输出:
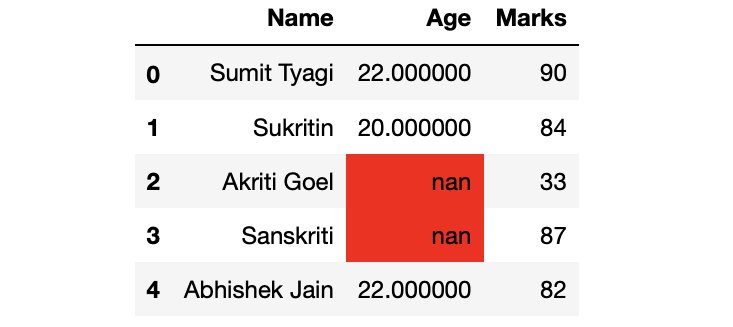
方法2:用纳米值代替背景突出显示文本
我们可以通过使用style属性的applymap()方法来做到这一点。applymap()方法需要一个函数,它接收一个标量并返回一个标量。
示例:
# Highlighting text instead of the
# cell's background
df.style.applymap(lambda cell: 'color:red' if pd.isnull(cell) else '')
输出:

方法3:突出显示带有纳米值的完整行的文本
我们可以使用apply()方法来做这件事
示例:
# Highlighting text of the complete row
df.style.apply(lambda row: np.repeat('color: red' if row.isnull().any() else '',
                                     row.shape[0]), axis=1)
输出:
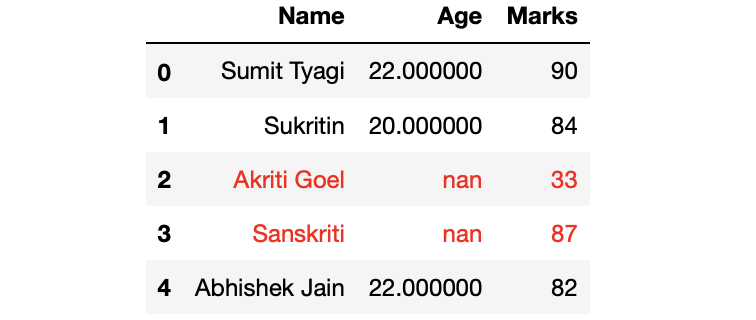
方法4:突出显示带有纳米值的完整行
# Highlighting the complete row
df.style.apply(lambda row: np.repeat('background: red' if row.isnull().any() else '', row.shape[0]), axis=1)
输出:
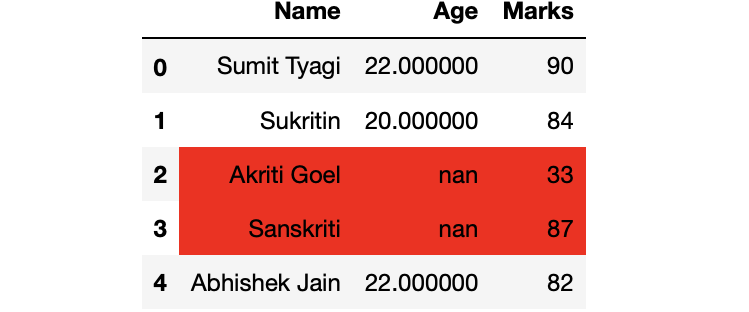
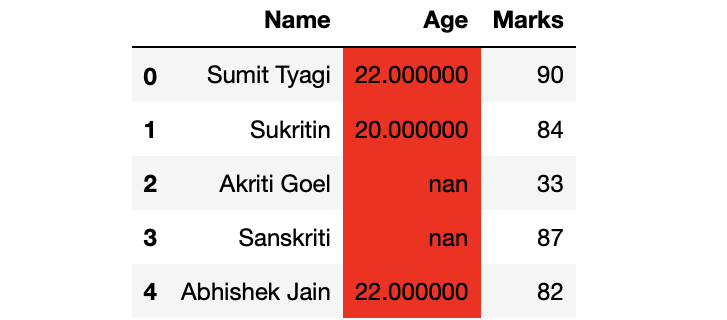
解决方案5:突出显示整列的纳米值
# Highlighting column with nan values
df.style.apply(lambda row: np.repeat('background: red' if row.isnull().any() else '',
                                                                row.shape[0]), axis=0)
输出:
 极客教程
极客教程