Python Pandas dataframe.pct_change()
Python是一种进行数据分析的伟大语言,主要是因为以数据为中心的Python包的奇妙生态系统。Pandas就是这些包中的一个,它使导入和分析数据变得更加容易。
Pandas dataframe.pct_change()函数计算当前和之前元素之间的百分比变化。这个函数默认计算的是紧接着的前一行的百分比变化。
注意:该函数在时间序列数据中大多有用。
语法: DataFrame.pct_change(periods=1, fill_method=’pad’, limit=None, freq=None, **kwargs)
参数 :
periods :形成百分比变化的转变时期。
fill_method :在计算百分比变化之前如何处理NAs。
limit : 在停止之前,连续填充NA的数量。
freq :使用时间序列API的增量(如’M’或BDay())。
**kwargs :额外的关键字参数被传递到DataFrame.shift或Series.shift。
返回:与调用对象相同的类型。
例子#1:使用pct_change()函数来查找时间序列数据的百分比变化。
# importing pandas as pd
import pandas as pd

# Creating the time-series index
ind = pd.date_range('01/01/2000', periods = 6, freq ='W')

# Creating the dataframe
df = pd.DataFrame({"A":[14, 4, 5, 4, 1, 55],
                   "B":[5, 2, 54, 3, 2, 32],
                   "C":[20, 20, 7, 21, 8, 5],
                   "D":[14, 3, 6, 2, 6, 4]}, index = ind)

# Print the dataframe
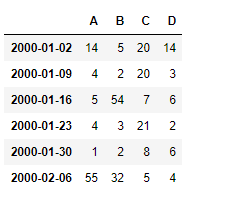
df

让我们使用dataframe.pct_change()函数来查找数据的变化百分比。
# find the percentage change with the previous row
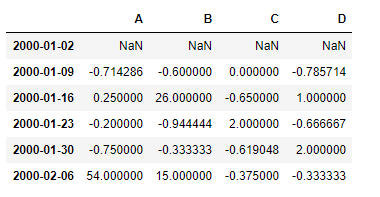
df.pct_change()
输出 :

第一行包含NaN值,因为没有前一行,我们可以从中计算出变化。
例子2:使用pct_change()函数来查找数据的百分比变化,该数据也有NaN值。
# importing pandas as pd
import pandas as pd

# Creating the time-series index
ind = pd.date_range('01/01/2000', periods = 6, freq ='W')

# Creating the dataframe
df = pd.DataFrame({"A":[14, 4, 5, 4, 1, 55],
                   "B":[5, 2, None, 3, 2, 32],
                   "C":[20, 20, 7, 21, 8, None],
                   "D":[14, None, 6, 2, 6, 4]}, index = ind)

# apply the pct_change() method
# we use the forward fill method to
# fill the missing values in the dataframe
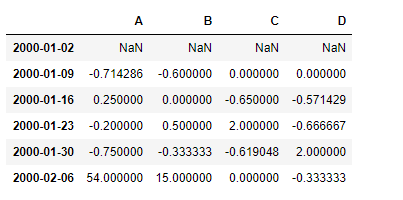
df.pct_change(fill_method ='ffill')
输出 :

第一行包含NaN值,因为没有前一行我们可以计算出变化。数据框中所有的NaN值都已经用fill方法填充。
 极客教程
极客教程