如何在Python中使用Pandas从excel表中创建一个带有多个索引的数据透视表
术语Pivot Table可以定义为Pandas函数,用于创建一个电子表格风格的透视表,作为一个DataFrame。它可以使用pivot_table()方法创建。
语法: pandas.pivot_table(data, index=None)
参数:
data : DataFrame
index: 列,Grouper,数组,或前面的列表。
返回值: DataFrame
注意:我们可以通过添加可选参数进一步过滤该表。
例子1:
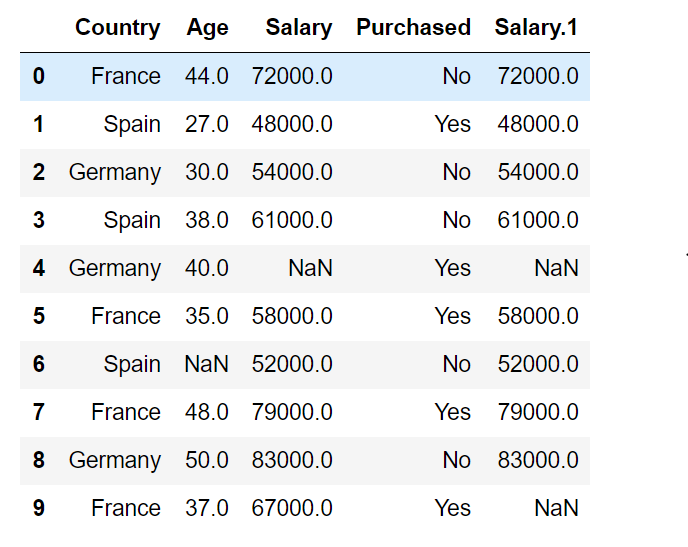
我们可以通过运行以下程序来看一下数据。
# importing pandas as pd
import pandas as pd

# Create the dataframe
df=pd.read_csv('GeeksForGeeks.csv')

# Print the dataframe
df
输出:

我们知道,索引是允许我们对数据进行分组的功能,在数据透视功能中指定多列作为索引,可以增加数据的细节和分组的水平。
在表中保留一个索引。
# importing pandas as pd
import pandas as pd

# Create the dataframe
df=pd.read_csv('GeeksForGeeks.csv')

# Print the resultant table
print(pd.pivot_table(df,index=["Country"]))
输出:

我们可以看到,分组是按国家进行的,数字数据被打印成与指定指数有关的所有数值的平均值。
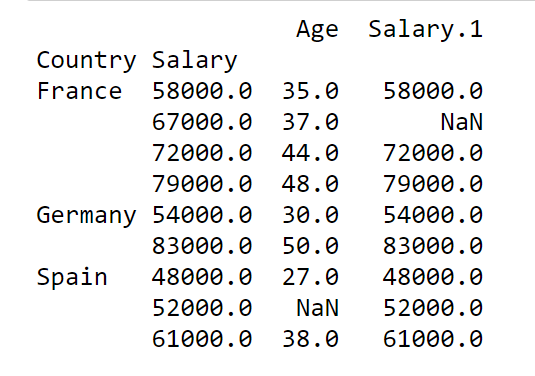
现在,在表中保留多个索引。
# importing pandas as pd
import pandas as pd

# Create the dataframe
df=pd.read_csv('GeeksForGeeks.csv')

# Print the resultant table
print(pd.pivot_table(df,index=["Country","Salary"]))
输出:

例子 2:
# importing pandas as pd
import pandas as pd

# Create the dataframe
df=pd.read_csv('GeeksForGeeks_1.csv')

# Print the dataframe
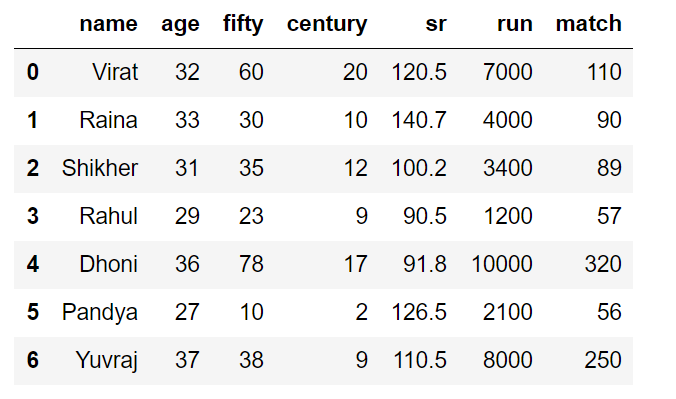
df
输出:

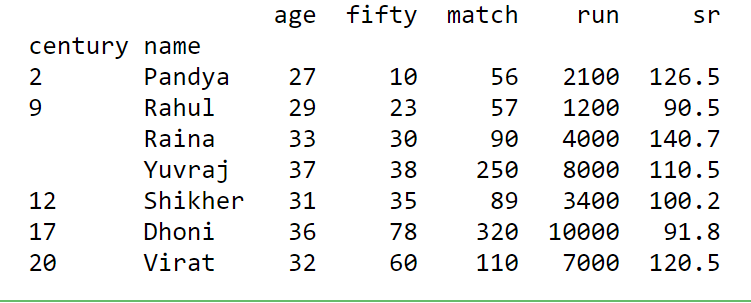
将球员的世纪得分和他们的名字作为指数,我们得到。
# importing pandas as pd
import pandas as pd

# Create the dataframe
df=pd.read_csv('dataset/new_players.csv')

# Print the resultant table
print(pd.pivot_table(df,index=["century","name"]))
输出:

 极客教程
极客教程