以表格方式显示Pandas数据框架
在这篇文章中,我们将看到如何以表格的形式显示一个DataFrame,并在行和列周围加上边框。以表格的形式显示DataFrame是很有必要的,因为它有助于数据的正确和容易的可视化。现在,让我们借助例子来看看有哪些方法可以实现这个目标。
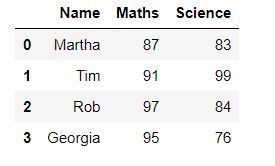
示例1 :以表格形式显示数据框架的一种方法是使用IPython.display的display()函数。
# importing the modules
from IPython.display import display
import pandas as pd

# creating a DataFrame
dict = {'Name' : ['Martha', 'Tim', 'Rob', 'Georgia'],
        'Maths' : [87, 91, 97, 95],
        'Science' : [83, 99, 84, 76]}
df = pd.DataFrame(dict)

# displaying the DataFrame
display(df)
输出 :

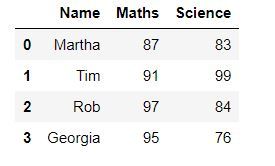
例子2:在这个例子中,我们将使用DataFrame.style。它返回一个Styler对象,该对象拥有用于格式化和显示DataFrame的有用方法。
# importing the module
import pandas as pd

# creating a DataFrame
dict = {'Name' : ['Martha', 'Tim', 'Rob', 'Georgia'],
        'Maths' : [87, 91, 97, 95],
        'Science' : [83, 99, 84, 76]}
df = pd.DataFrame(dict)

# displaying the DataFrame
df.style
输出 :

示例3 :使用DataFrame.style我们也可以为我们的数据框架表添加不同的样式。比如,在这个例子中,我们将用蓝色显示所有大于90的值,其余的用黑色。为了实现这一点,我们将使用DataFrame.style.applymap()来遍历表格中的所有值并应用该样式。
# importing the modules
import pandas as pd
import numpy as np

def color_negative_red(val):
    """
    Takes a scalar and returns a string with
    the css property `'color: red'` for negative
    strings, black otherwise.
    """
    color = 'blue' if val > 90 else 'black'
    return 'color: % s' % color

# creating a DataFrame
dict = {'Maths' : [87, 91, 97, 95],
        'Science' : [83, 99, 84, 76]}
df = pd.DataFrame(dict)

# displaying the DataFrame
df.style.applymap(color_negative_red)
输出 :

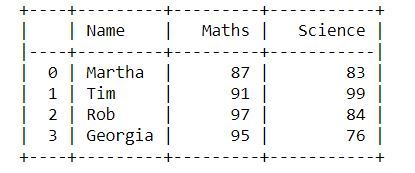
例子4:我们也可以使用一个叫做tabulate的库来实现这个目的。它是一个包含不同风格的数据帧显示的库。在这个例子中,我们将使用 “psql “样式。
# importing the modules
from tabulate import tabulate
import pandas as pd

# creating a DataFrame
dict = {'Name':['Martha', 'Tim', 'Rob', 'Georgia'],
        'Maths':[87, 91, 97, 95],
        'Science':[83, 99, 84, 76]}
df = pd.DataFrame(dict)

# displaying the DataFrame
print(tabulate(df, headers = 'keys', tablefmt = 'psql'))
输出 :

以下是你可以使用的所有样式。
- “plain”
- “simple”
- “github”
- “grid”
- “fancy_grid”
- “pipe”
- “orgtbl”
- “jira”
- “presto”
- “pretty”
- “psql”
- “rst”
- “mediawiki”
- “moinmoin”
- “youtrack”
- “html”
- “latex”
- “latex_raw”
- “latex_booktabs”
- “textile”
 极客教程
极客教程