如何在Tkinter中运行matplotlib?
Python的一个众所周知的用例是机器学习和数据科学。为了可视化和绘制数据集,我们使用Matplotlib库。要在Tkinter应用程序中绘制matplotlib图形,我们必须通过初始化“ from matplotlib.pyplot as plt ”来导入库。可以通过定义范围值或导入笔记本中的数据集来绘制图。
示例
#导入所需库
from tkinter import *
from tkinter import ttk
import numpy as np
import matplotlib.pyplot as plt

#创建Tkinter框架实例
win= Tk()

#设置窗口几何形状
win.geometry("700x250")

def graph():
   car_prices= np.random.normal(50000,4000,2000)
   plt.figure(figsize=(7,3))
   plt.hist(car_prices, 25)
   plt.show()

#创建一个按钮来绘制图形
button= ttk.Button(win, text= "Graph", command= graph)
button.pack()

win.mainloop()
输出
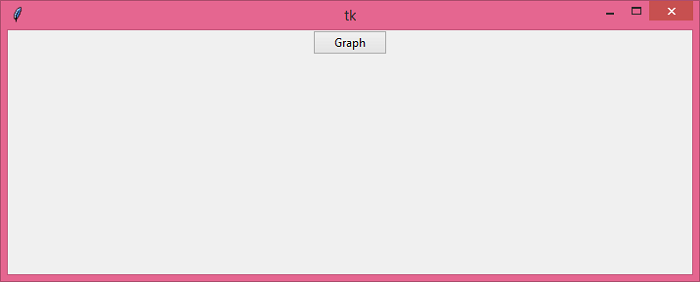
运行上述代码将显示一个包含一个按钮的窗口。
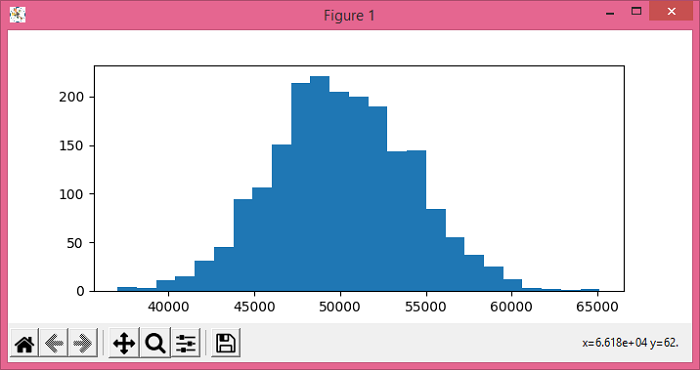
当我们点击“Graph”按钮时,它会在主窗口上显示一个图形。
 极客教程
极客教程
