如何在Tkinter中运行Matplotlib?
Python Matplotlib库在许多应用程序中可视化给定的数据和信息时用于绘制图表和图像。在Tkinter应用程序中运行Matplotlib是可能的。通常,在应用程序中显式导入任何Python库可以访问库中的所有功能和模块。
要创建一个使用Matplotlib和其函数的GUI应用程序,我们必须使用命令 from matplotlib.pyplot as plt 导入库。然而,我们还使用 Tkagg 使用Tkinter用户界面进行交互的后端。
示例
在此示例中,我们已导入 Tkagg 和 matplotlib 通过将给定数据点绘制在一个画布小部件中来可视化它们。
#导入所需库
from tkinter import *
from tkinter import ttk
import matplotlib
from matplotlib.figure import Figure
from matplotlib.backends.backend_tkagg import FigureCanvasTkAgg

#创建tkinter框架的实例
win= Tk()

#设置窗口大小
win.geometry("700x350")

#使用TkAgg
matplotlib.use("TkAgg")

#创建特定大小的图形
figure = Figure(figsize=(3, 3), dpi=100)

#定义绘制图形的点
plot = figure.add_subplot(1, 1, 1)
plot.plot(0.5, 0.3, color="blue", marker="o", linestyle="")

#为x和y轴定义数据点
x = [0.2,0.5,0.8,1.0 ]
y = [ 1.0, 1.2, 1.3,1.4]
plot.plot(x, y, color="red", marker="x", linestyle="")

#添加一个画布小部件以将图形与画布相关联
canvas = FigureCanvasTkAgg(figure, win)
canvas.get_tk_widget().grid(row=0, column=0)

win.mainloop()
输出
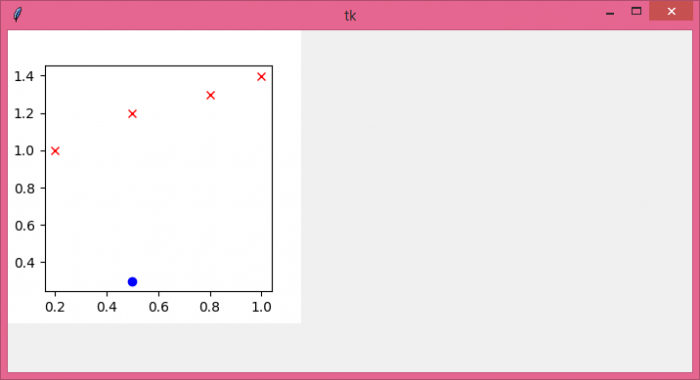
当我们运行上述代码时,在窗口中会出现一个绘图,其中X轴和Y轴上有一些数据点。
 极客教程
极客教程